
eCommerce platforms often run into recurring performance issues like carts abandoned despite strong traffic, slow product page loads, inconsistent search behavior, and API spikes during checkout. The symptoms are visible, but the exact causes remain hidden.
Turning Hidden Symptoms into Insights
After seeing recurring performance problems, the next step is to uncover their root cause. New Relic’s Query Language (NRQL) makes this possible. Most engineers think of New Relic only as alerts and APM traces. But under the hood, the New Relic Query Language (NRQL) is the real engine that powers insights. With SQL-like syntax, it queries transactions, logs, metrics, events, and traces to reveal hidden issues and provide precise answers.
- Querying PDP, PLP, CMS, and checkout load times directly.
- Isolating API latency spikes during checkout.
- Surfacing anomalies in search traffic or customer login flows.
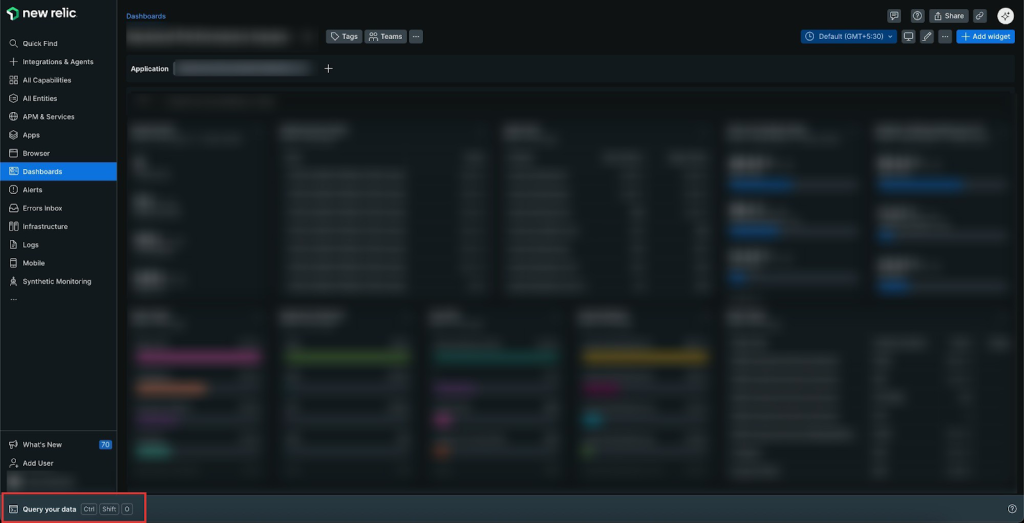
Dashboards That Speak Business
Dashboards are where those raw insights are organized and communicated. Each panel is a pinned query with a visualization and a time window. Together, they become the story of your commerce engine.
- Multi storefront monitoring: Compare domains side by side.
- Business view: See transactions tied to PDPs, PLPs, cart, and checkout.
- Collaboration: Apply filters (e.g., us.example.com) and watch other widgets update instantly.
Dashboards convert technical outputs into business KPIs, showing page speed, visitor counts, and cart drop‑offs all in one glance.
From Problems to NRQL Solutions
Now that we’ve seen how NRQL exposes raw data and dashboards visualize the big picture, let’s connect it back to real-world issues. Below are common eCommerce problems and the specific NRQL queries that help uncover their causes.
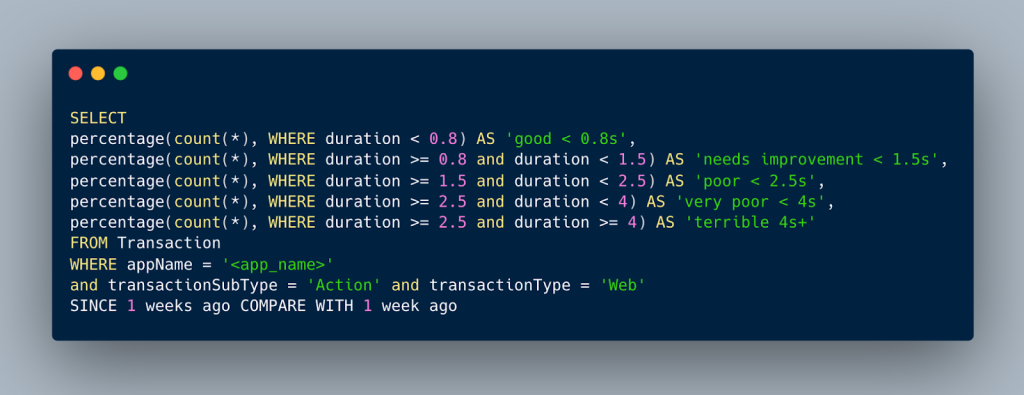
Problem 1: Checkout feels slow during peak hours
During heavy traffic, checkout pages often slow down. The query below classifies response times (TTFB) into performance bands so you can see how many requests are fast, borderline, or failing.
SELECT percentage(count(*), WHERE duration < 0.8) AS ‘good < 0.8s’,
percentage(count(*), WHERE duration >= 0.8 and duration < 1.5) AS ‘needs improvement < 1.5s’,
percentage(count(*), WHERE duration >= 1.5 and duration < 2.5) AS ‘poor < 2.5s’,
percentage(count(*), WHERE duration >= 2.5 and duration < 4) AS ‘very poor < 4s’,
percentage(count(*), WHERE duration >= 4) AS ‘terrible 4s+’
FROM Transaction
WHERE appName = ‘<app_name>’
AND transactionSubType = ‘Action’
AND transactionType = ‘Web’
SINCE 1 week ago COMPARE WITH 1 week ago
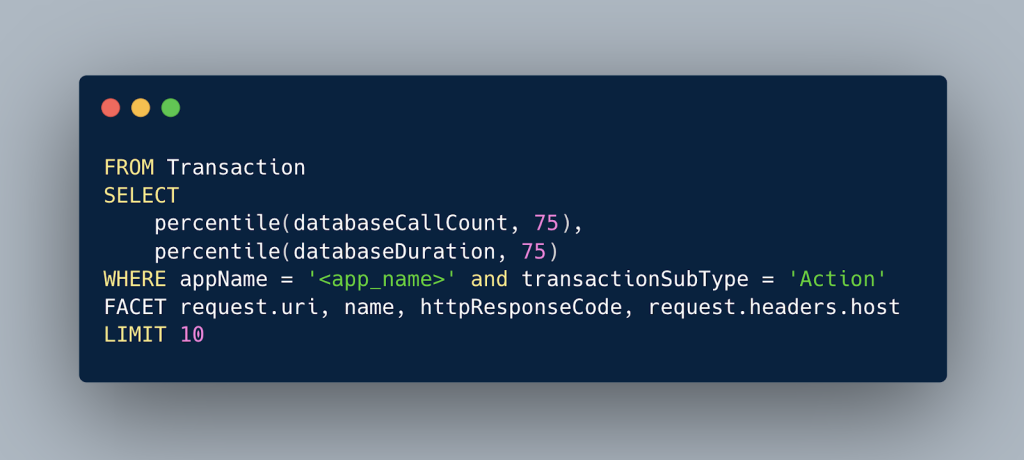
Problem 2: Product pages are consuming server resources
Heavy product pages often trigger high database call counts or long query durations. The query below helps identify which pages are responsible by surfacing URIs with the highest DB operations and duration, so you know where to optimize.
FROM Transaction
SELECT percentile(databaseCallCount, 75), percentile(databaseDuration, 75)
WHERE appName = ‘<app_name>’
AND transactionSubType = ‘Action’
FACET request.uri, name, httpResponseCode, request.headers.host
LIMIT 10
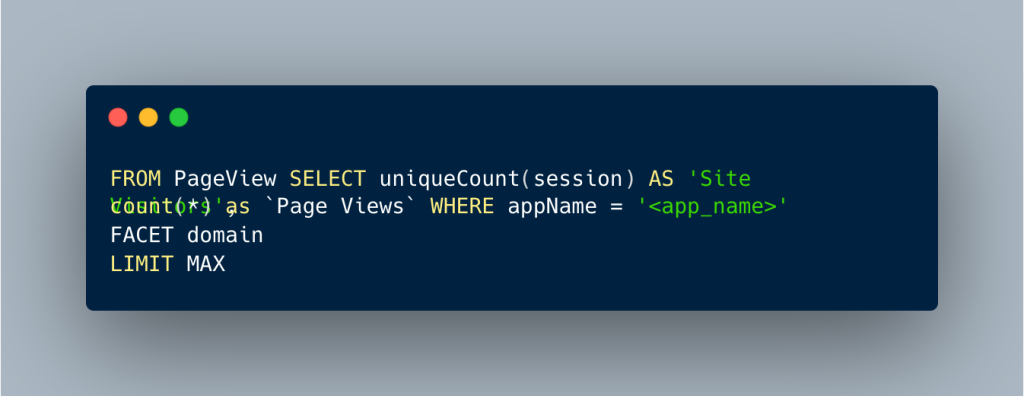
Problem 3: Search results vary by region
Search performance often differs across domains or regions, which can frustrate customers in specific markets. The query below breaks down site visitors and page views by domain so you can quickly spot underperforming regions.
FROM PageView
SELECT uniqueCount(session) AS ‘Site Visitors’, count(*) AS ‘Page Views’
WHERE appName = ‘<app_name>’
FACET domain
LIMIT MAX
Instead of debating what might be wrong, NRQL puts evidence on the table.
Your NRQL Toolkit
This section is a quick reference cheat sheet. It provides the same queries in a clean format, ready to copy, run, and pin into dashboards without extra narrative.
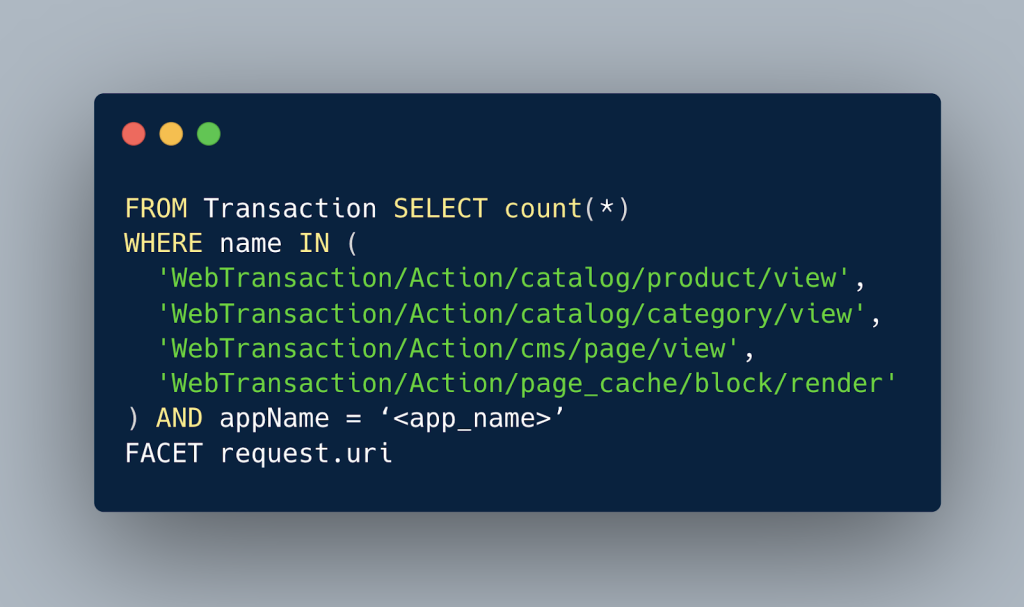
Top URL Hits by Page Type
FROM Transaction
SELECT count(*)
WHERE name IN (
‘WebTransaction/Action/catalog/product/view’,
‘WebTransaction/Action/catalog/category/view’,
‘WebTransaction/Action/cms/page/view’,
‘WebTransaction/Action/page_cache/block/render’
)
AND appName = ‘<app_name>’
FACET request.uri
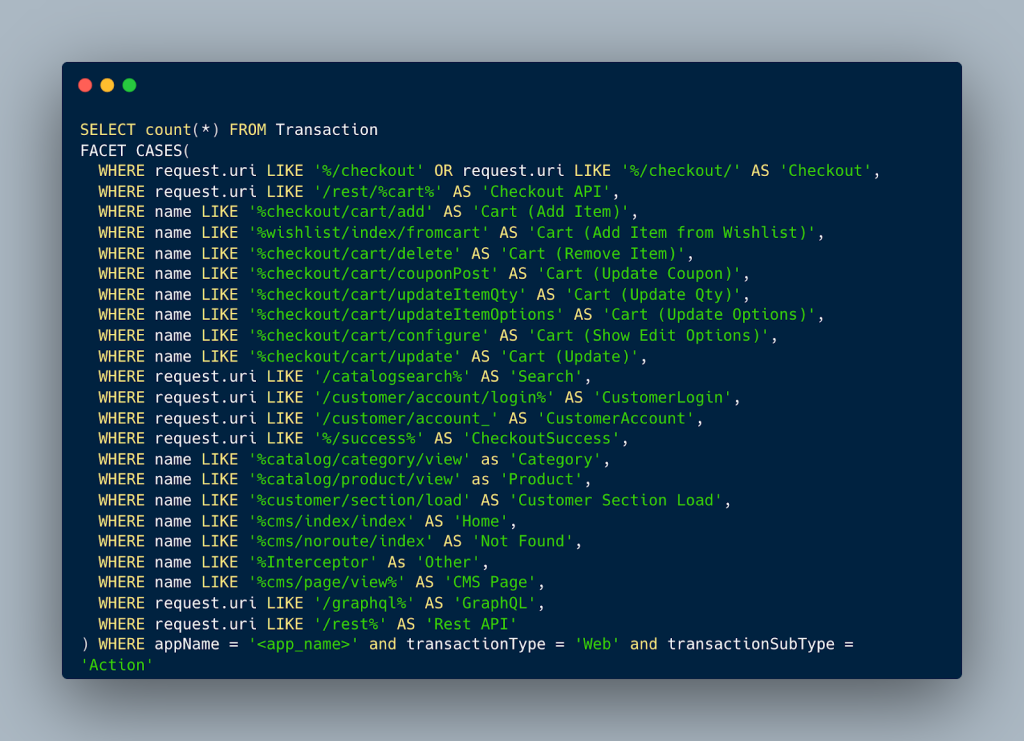
Critical Page and API Volume Breakdown
SELECT count(*) FROM Transaction
FACET CASES(
WHERE request.uri LIKE ‘%/checkout’ OR request.uri LIKE ‘%/checkout/’ AS ‘Checkout’,
WHERE request.uri LIKE ‘/rest/%cart%’ AS ‘Checkout API’,
WHERE name LIKE ‘%checkout/cart/add’ AS ‘Cart (Add Item)’,
WHERE name LIKE ‘%wishlist/index/fromcart’ AS ‘Cart (Add Item from Wishlist)’,
WHERE name LIKE ‘%checkout/cart/delete’ AS ‘Cart (Remove Item)’,
WHERE name LIKE ‘%checkout/cart/couponPost’ AS ‘Cart (Update Coupon)’,
WHERE name LIKE ‘%checkout/cart/updateItemQty’ AS ‘Cart (Update Qty)’,
WHERE name LIKE ‘%checkout/cart/updateItemOptions’ AS ‘Cart (Update Options)’,
WHERE name LIKE ‘%checkout/cart/configure’ AS ‘Cart (Show Edit Options)’,
WHERE name LIKE ‘%checkout/cart/update’ AS ‘Cart (Update)’,
WHERE request.uri LIKE ‘/catalogsearch%’ AS ‘Search’,
WHERE request.uri LIKE ‘/customer/account/login%’ AS ‘CustomerLogin’,
WHERE request.uri LIKE ‘/customer/account_’ AS ‘CustomerAccount’,
WHERE request.uri LIKE ‘%/success%’ AS ‘CheckoutSuccess’,
WHERE name LIKE ‘%catalog/category/view’ AS ‘Category’,
WHERE name LIKE ‘%catalog/product/view’ AS ‘Product’,
WHERE name LIKE ‘%customer/section/load’ AS ‘Customer Section Load’,
WHERE name LIKE ‘%cms/index/index’ AS ‘Home’,
WHERE name LIKE ‘%cms/noroute/index’ AS ‘Not Found’,
WHERE name LIKE ‘%Interceptor’ AS ‘Other’,
WHERE name LIKE ‘%cms/page/view%’ AS ‘CMS Page’,
WHERE request.uri LIKE ‘/graphql%’ AS ‘GraphQL’,
WHERE request.uri LIKE ‘/rest%’ AS ‘Rest API’
)
WHERE appName = ‘<app_name>’
AND transactionType = ‘Web’
AND transactionSubType = ‘Action’
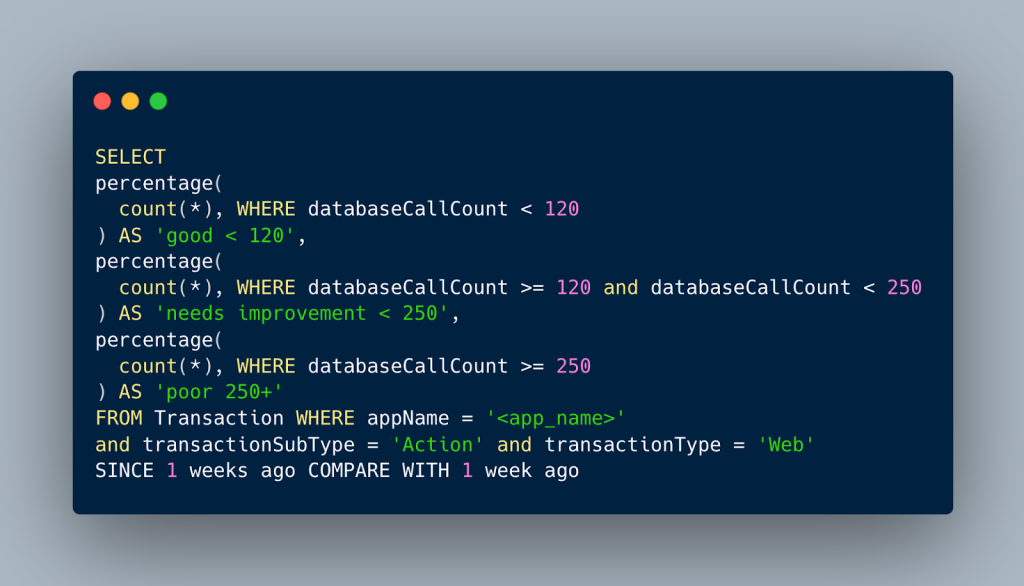
DB Call Count Quality Bands
SELECT percentage(count(*), WHERE databaseCallCount < 120) AS ‘good < 120’,
percentage(count(*), WHERE databaseCallCount >= 120 and databaseCallCount < 250) AS ‘needs improvement < 250’,
percentage(count(*), WHERE databaseCallCount >= 250) AS ‘poor 250+’
FROM Transaction
WHERE appName = ‘<app_name>’
AND transactionSubType = ‘Action’
AND transactionType = ‘Web’
SINCE 1 week ago COMPARE WITH 1 week ago
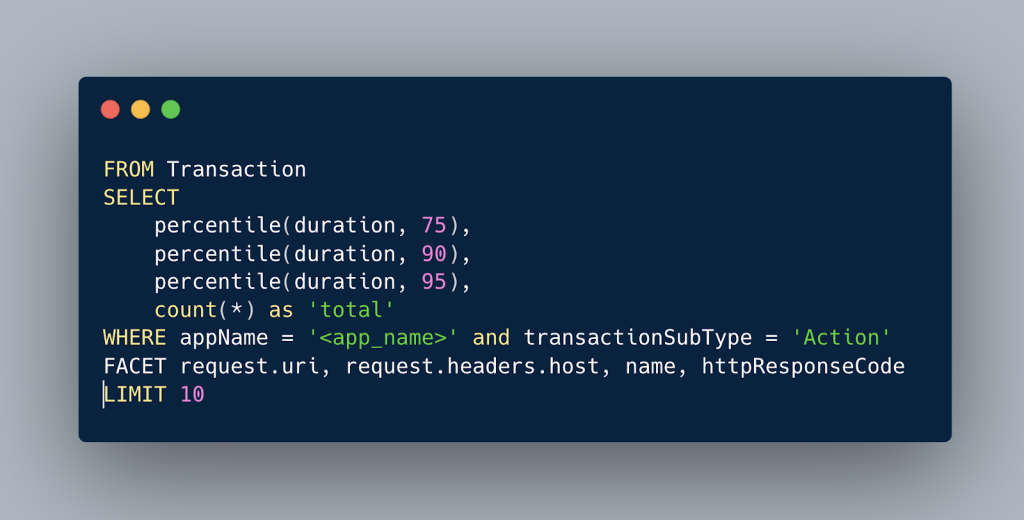
Top 10 Slow Requests by TTFB
FROM Transaction
SELECT percentile(duration, 75), percentile(duration, 90), percentile(duration, 95), count(*) as ‘total’
WHERE appName = ‘<app_name>’
AND transactionSubType = ‘Action’
FACET request.uri, request.headers.host, name, httpResponseCode
LIMIT 10
The Business Impact
When NRQL is embedded into your workflow, the difference is measurable:
- Faster root cause analysis → less downtime.
- Consistent performance across domains → better customer trust.
- Fewer checkout failures → reduced cart abandonment.
- Better visibility for business teams → shared accountability.
For eCommerce organizations, this isn’t just a technical upgrade. It’s a shift from reactive monitoring to proactive optimization.
Conclusion
This reference keeps focus on how to query and what to pin. Start with the Core eCommerce Query Pack to baseline site health, extend with Advanced Queries to isolate bottlenecks, and pin the most useful widgets to a shared dashboard. That flow is usually enough to move from hunches to grounded, repeatable diagnostics.


