



Shopify
Shopify GraphQL Admin API Migration Guide for Custom Apps and Integrations
Anusree V Anand|Nov 16, 2026|Read 8 Min




Store Decode is a Codilar-built Shopify heatmap app that shows what shoppers saw, clicked, and ordered on your homepage, collections, product pages, and cart. This helps you understand where your Shopify store wins orders and where it loses them.
With Shopify Analytics, you only see the number of users who visited and how many of them ordered. However, it fails to tell you what section of the page they reached, what they tapped, and where they gave up. Store Decode fills that gap, breaking the homepage down section by section, showing views, clicks per 100 views, dead clicks, and orders after a click. Separate tabs cover collections, product pages, the cart and traffic sources, each with its own set of metrics. You can also break down the data by device, country and traffic source to see how shopping activity varies across different groups of visitors.
Store Decode started as a store audit tool, which is still available under Audit in the app. This guide covers the newer feature that tracks shopper activity across individual sections of the Shopify theme.
Store Decode turns your Shopify store homepage into a map, one block per section, so you can see how the page performs as a whole before you look at any single part. You choose what the colors show, whether that is Views, Clicks, Dead clicks or Orders, and the sections that matter stand out at a glance.
Select a block and you get that section's Views, clicks per 100 views, time on screen, dead clicks and orders after a click. This is Shopify section analytics, and it goes down to each slide in a slider, so a slider stops being a single number. On mobile, a dashed line marks where the typical first screen ends, which shows you what a shopper gets before they scroll.
Rename sections lets you give each section the name your team uses, and Download CSV exports the numbers to a spreadsheet when you want them. In Settings, you can exclude your own visits and pause collection while you redesign.
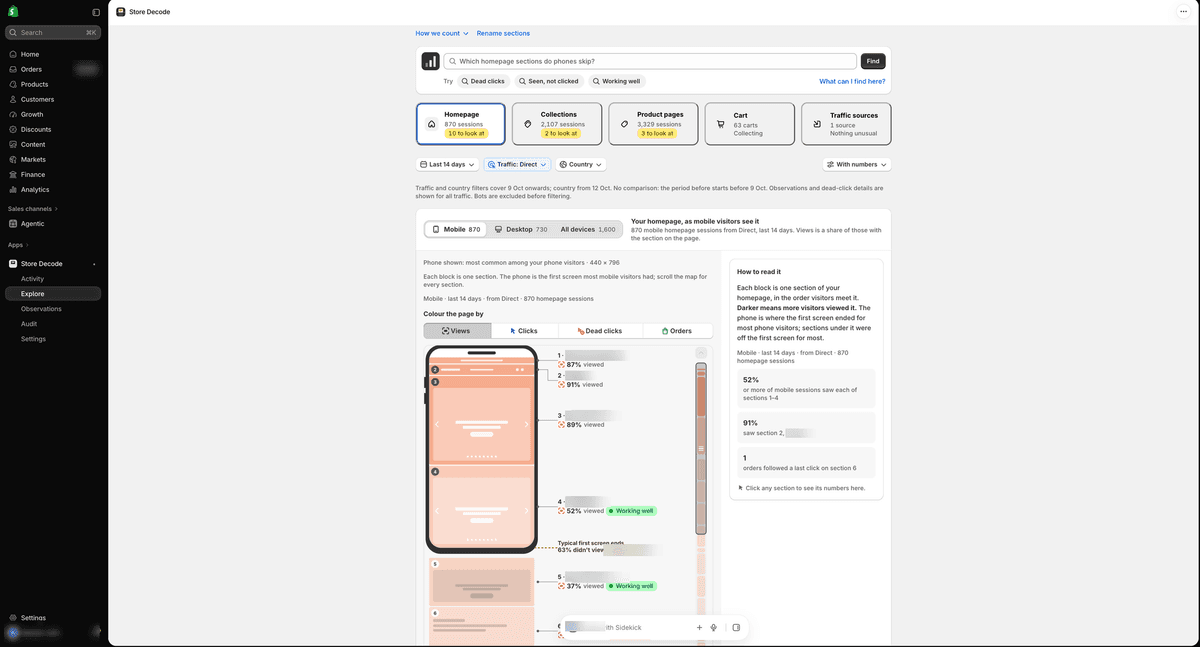
A heatmap shows attention as color. Store Decode counts it across every visitor, so you can put one section next to another and see which ones earn their place. It works down to the slide. Every slide in a slider gets its own Views and clicks per 100 views, so you can see which slide shoppers reach and which one they click.
Switch between Mobile and Desktop, and split the data by traffic source and country, to compare what each group sees and clicks.
Shoppers tap images, headings, and cards expecting them to work. When an element isn't a link, button, or other interactive control, Store Decode records the tap as a dead click and tracks the count for each section. Every dead click is counted, and the tag appears once a section reaches 50 or more with 300 sessions behind it. You can see which sections need attention without manually checking every element on your Shopify store.
A common cause is a slide where only the button is linked and shoppers tap the image around it. The fix is to link the whole slide or make the button easier to spot.
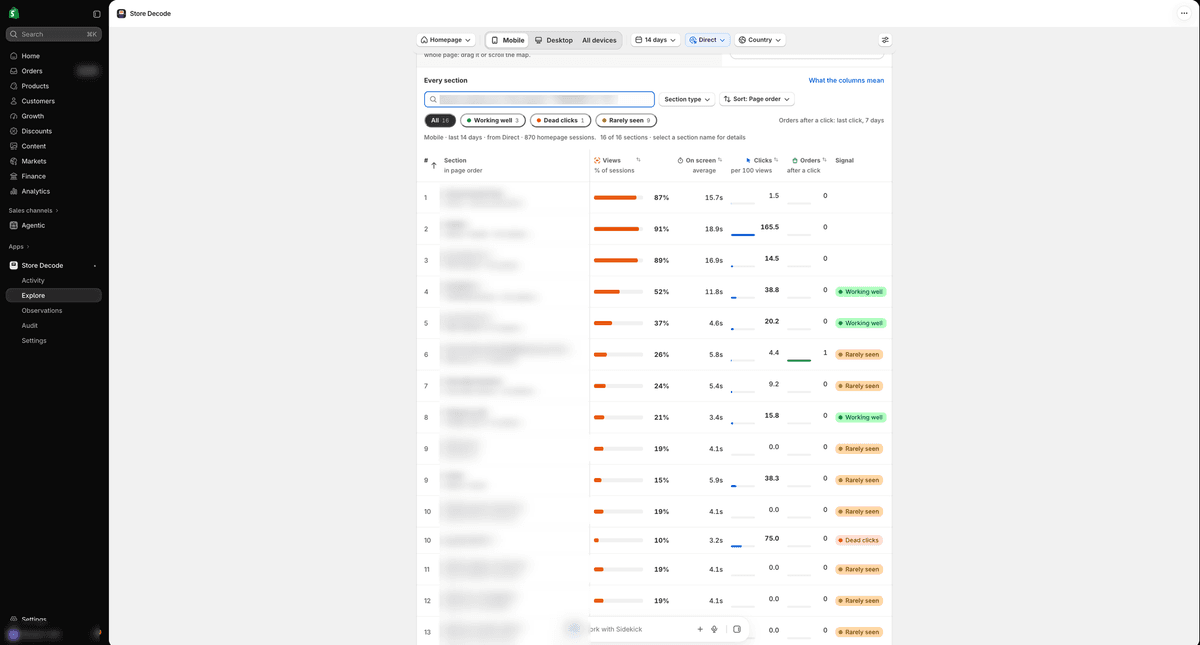
Also, each section gets a signal, including Working well, Rarely seen, or Dead clicks.Filter by status to see which sections need attention. Store Decode also tracks orders placed within seven days of a click, attributing them to the last section clicked.
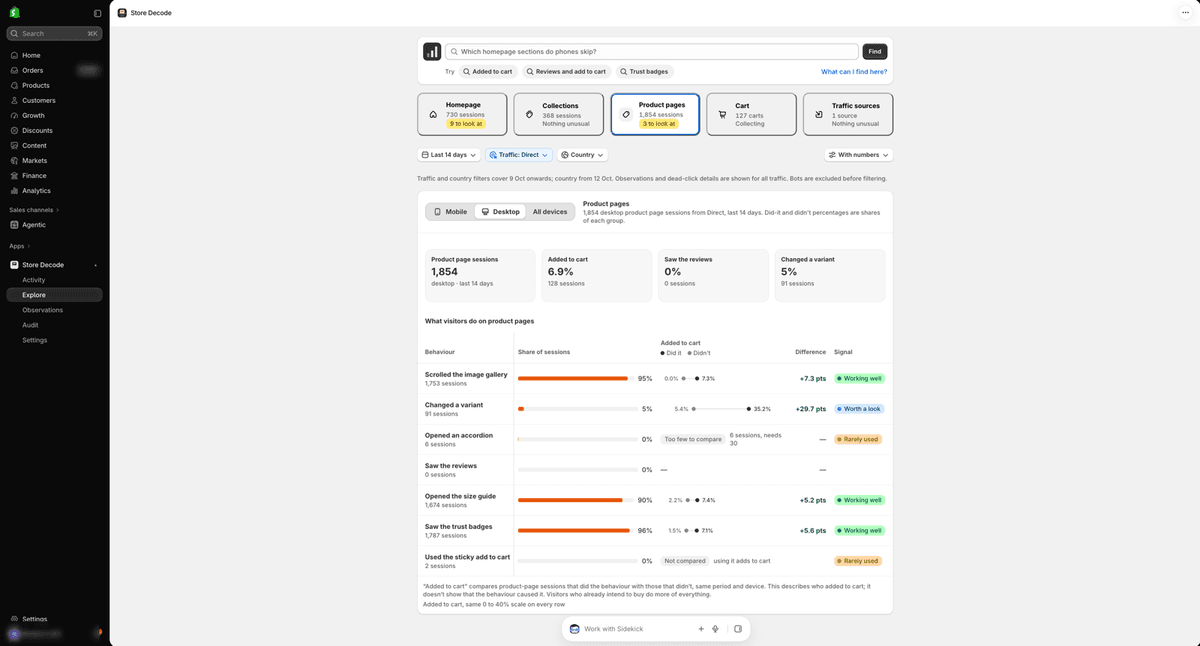
The homepage is where the Store Decode app starts. The following are the four more tabs that take the same view as the rest of the store.
The page map and the tabs show you where shoppers click and where they skip. The features below cover what comes next:
Every night, after your store's day closes, Store Decode checks the last 7 or 14 days of data against set rules and writes up what it finds. Each Observation states one fact about a section or page, with the device, time window and session count behind it, and a card can carry one option to try, phrased as "You could:". Some nights produce no cards, because a rule only fires once it has enough data. The top three shown on Home are worth a look.
When you act on an Observation, choose Mark as done. Store Decode then compares the week before your change with the first and second weeks after it, and tells you whether the numbers came out Higher after, About the same, or Lower after. It compares dates, so it is not an A/B test.
A search box inside the app. Type a question in plain words, such as "which homepage sections do phones skip", and it opens the matching view with the page, device, and time window already set. Find only reads your measurements and never changes your theme. Not sure what to ask? Find suggests a starting point on every tab:
Store Decode adds its tools to Sidekick, the assistant in your Shopify admin, so you can ask in your own words and get Store Decode's numbers back with a link that opens the matching view. The tools only read, so they never change your store, theme, or settings. If Store Decode does not measure something, the reply says so and gives no number.
A live list of visits from the last 48 hours. Each page view card shows the page, device and country, and marks each section as seen, seen and clicked, or not seen.
Store Decode runs as a theme script on standard and customized Online Store themes, so there are no events to tag and no tool to host. Setup is an install and one switch:
If you have "Don't count my visits" on in your browser, use a private window, and accept analytics if your store shows a cookie banner.
Store Decode gives every section of your store its own metrics, including:
The app is free to install and takes a few steps to set up.
Install Store Decode from the Shopify App Store and start with the mobile page map. The dashed line marks the bottom of the typical first screen. Everything below it requires shoppers to scroll to see it.
When the data indicates changes that require development work, Codilar's team can build and implement them. Connect to our Shopify Plus expertise.
Store Decode is Codilar's Shopify store section-level analytics. It measures each homepage section and your collection and product pages, and shows views, clicks per 100 views, dead clicks and orders after a click for every section. It is listed on the Shopify App Store as Store Decode: Scroll Heatmaps.
No, Shopify Analytics shows what your store sold, including orders, sales, and visits across the whole store. Whereas Store Decode shows what shoppers do on each page: which sections they see, which they click and which clicks lead nowhere. Use Shopify Analytics to spot a drop, then open Store Decode to find the section behind it.
Open the page map in Store Decode and switch it to Dead clicks. A dead click is a click on something that is not a link, button or other control, such as an image or card that looks clickable. A section gets the Dead clicks signal at 50 or more, once 300 sessions have had it on the page.
Yes, collections show scroll depth, filter use, and which product cards shoppers see and skip. Product pages compare add-to-cart rates for shoppers who opened the size guide, viewed the reviews, or changed a variant, with those who did not. Cart shows whether shoppers who saw an upsell or opened the discount field reached checkout.
No, the script is a few kilobytes and loads asynchronously, so it never delays a click. Store Decode is built so that your store's functionality comes first, with tracking second.

Get tailored technology solutions to scale your retail business online
Request A Quote

Stay ahead with insights, trends, and brand success stories from the world of Digital Commerce.


With the world's leading digital commerce agency.